pacman::p_load(
  ggHoriPlot,
  ggthemes,
  tidyverse
)Horizon Plot
Getting Started
Load libraries
In this exercise, we will be requiring the following libraries.
Data Import
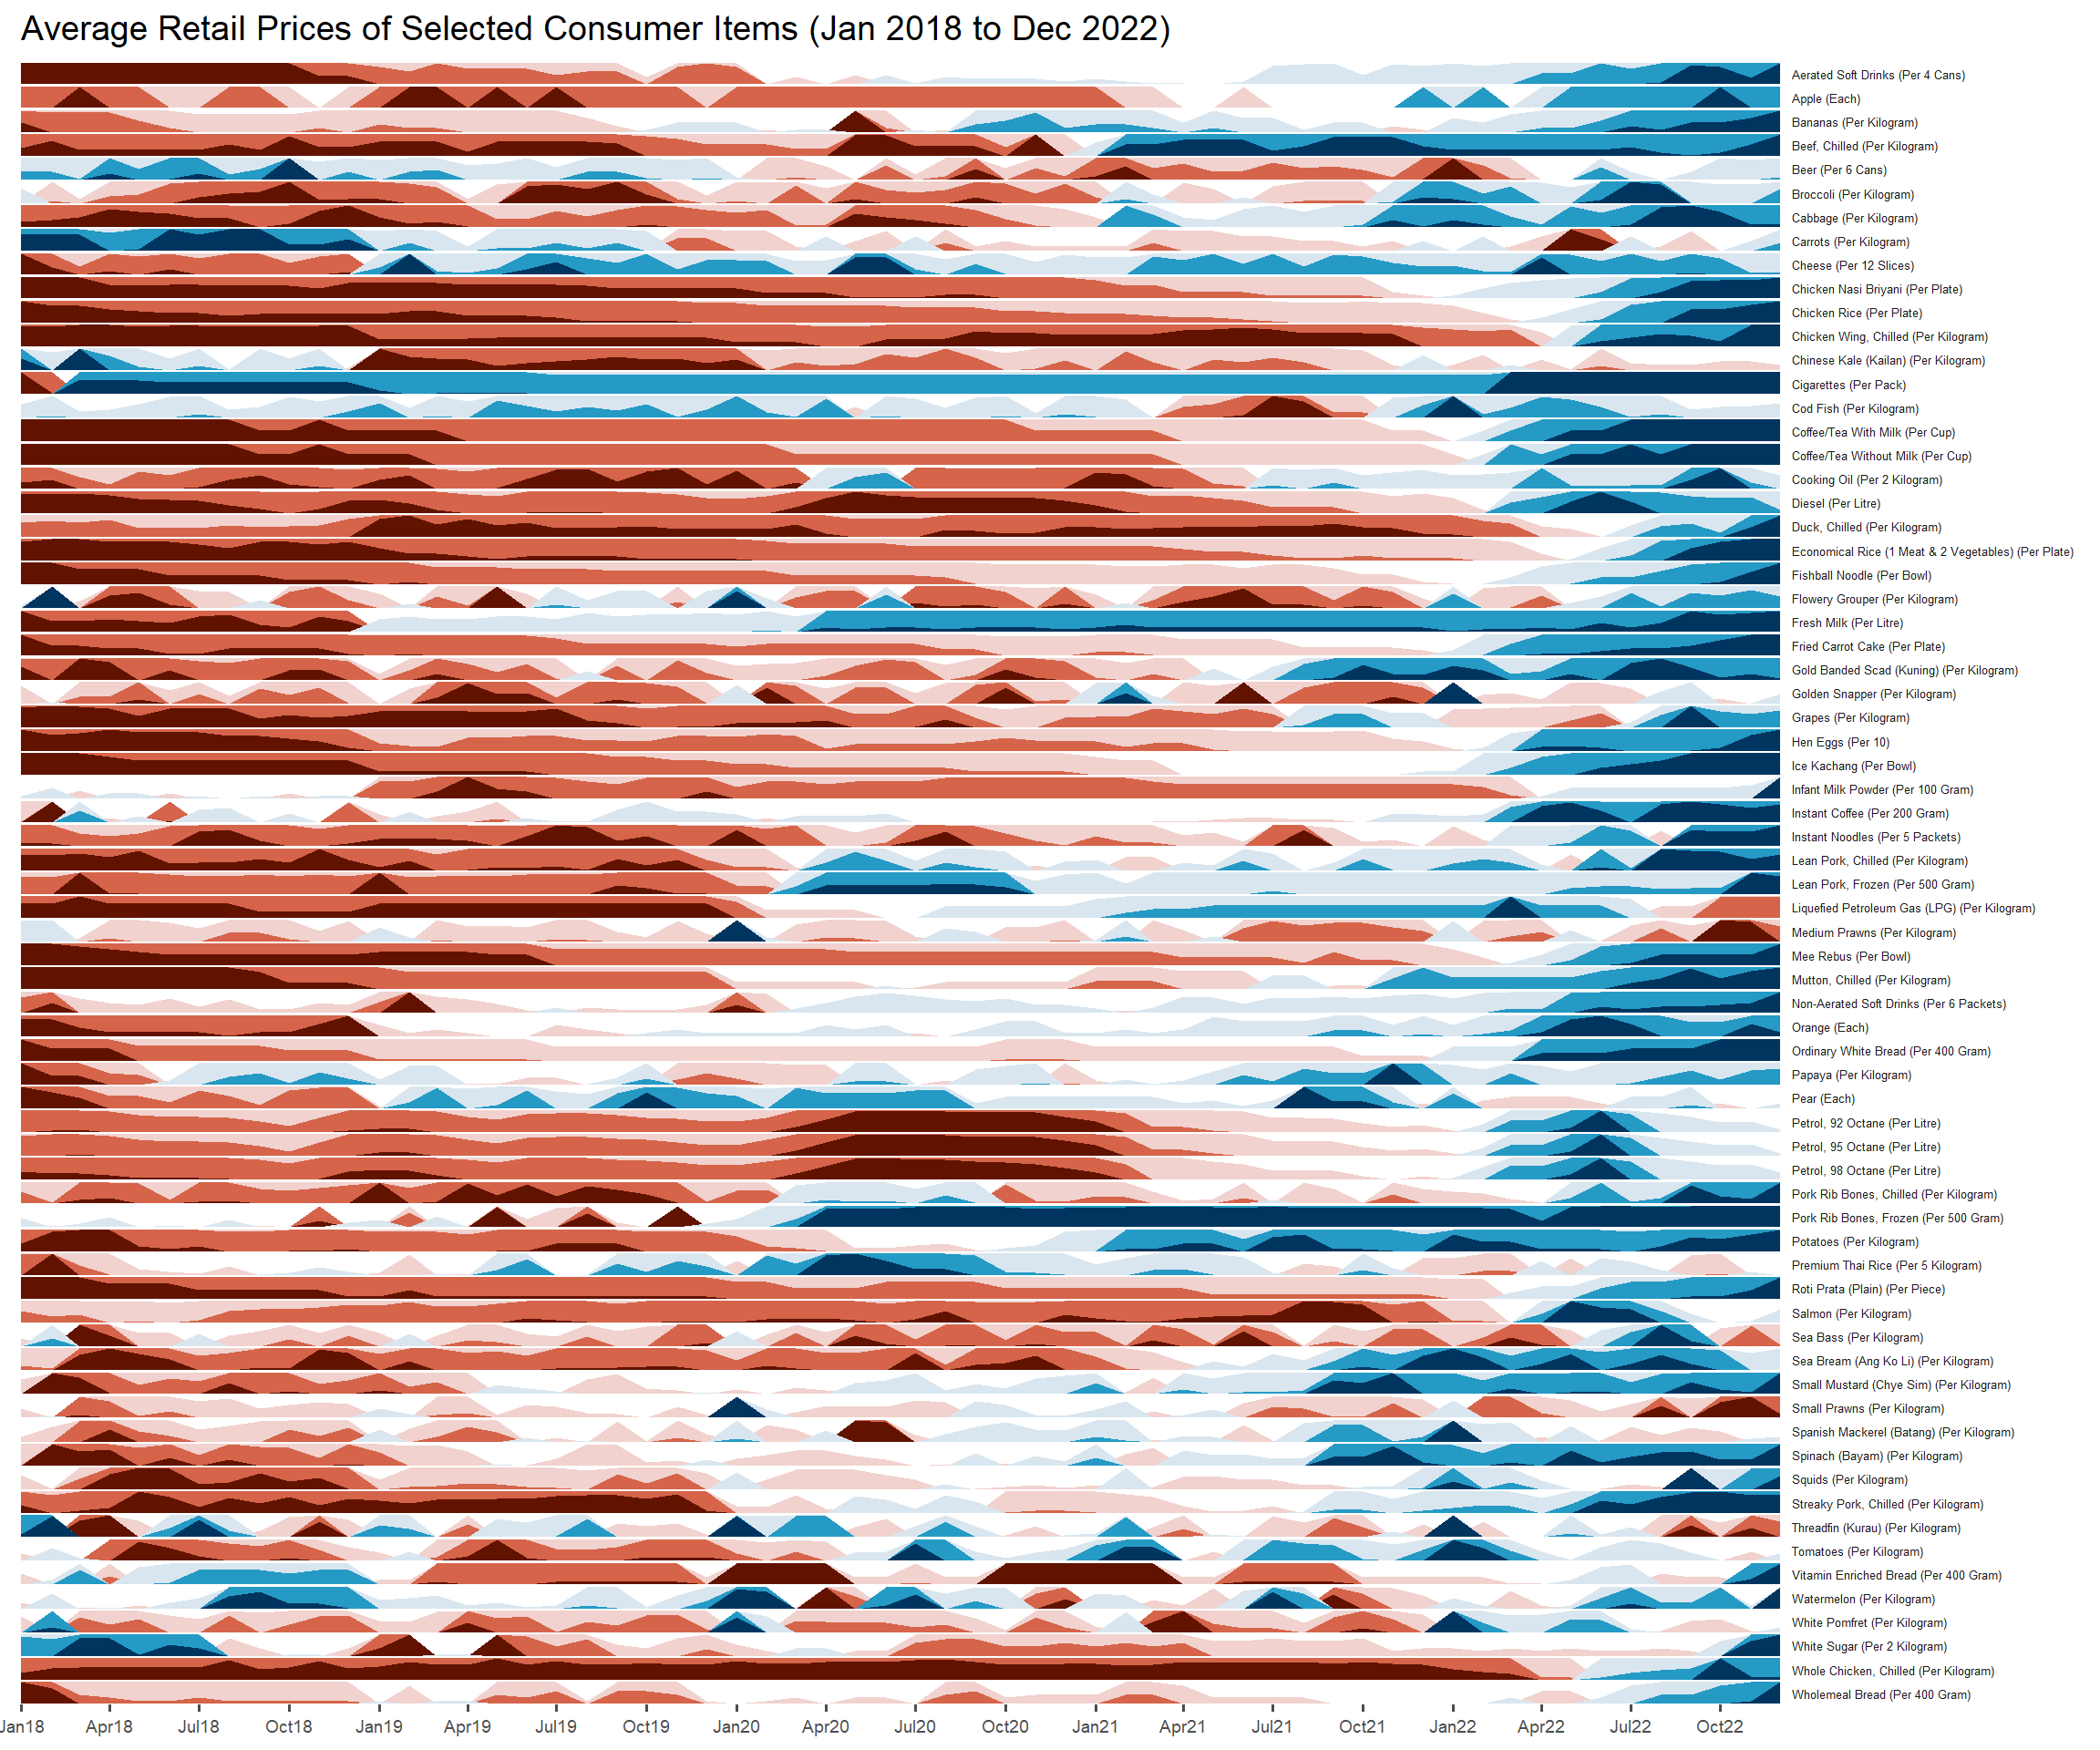
For this hands-on exercise, Average Retail Prices Of Selected Consumer Items will be used. In addition, we use the mutate function to format the date column in the correct Date type format instead of character type.
averp <- read_csv("data/AVERP.csv") %>%
  mutate(`Date` = dmy(`Date`))
Plotting the Horizon Graph
averp %>%
  filter(Date >= "2018-01-01") %>%
  ggplot() +
  geom_horizon(aes(x = Date, y=Values),
               origin = "midpoint",
               horizonscale = 6)+
  facet_grid(`Consumer Items`~.) +
    theme_few() +
  scale_fill_hcl(palette = 'RdBu') +
  theme(panel.spacing.y=unit(0, "lines"), strip.text.y = element_text(
    size = 5, angle = 0, hjust = 0),
    legend.position = 'none',
    axis.text.y = element_blank(),
    axis.text.x = element_text(size=7),
    axis.title.y = element_blank(),
    axis.title.x = element_blank(),
    axis.ticks.y = element_blank(),
    panel.border = element_blank()
    ) +
    scale_x_date(expand=c(0,0), date_breaks = "3 month", date_labels = "%b%y") +
  ggtitle('Average Retail Prices of Selected Consumer Items (Jan 2018 to Dec 2022)')